|
|
Post by M57 on Aug 21, 2018 15:58:32 GMT -6
Just print this out and tape it above your pultec. BOOM. 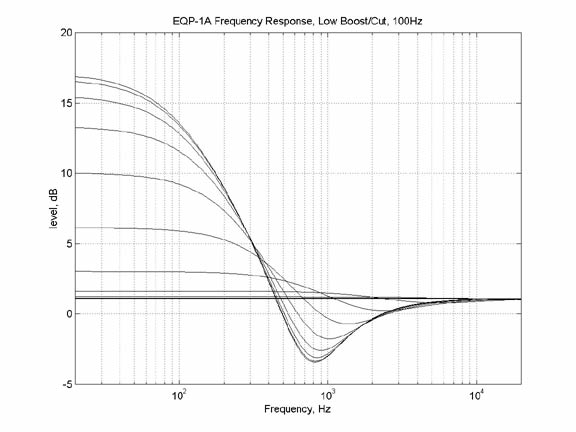 Of course this is just about completely unhelpful. Does it assume equal amounts of cut and boost? Is that how you use it? |
|
|
|
Post by svart on Aug 21, 2018 16:26:08 GMT -6
Just print this out and tape it above your pultec. BOOM. Of course this is just about completely unhelpful. Does it assume equal amounts of cut and boost? Is that how you use it? Lol, it was a joke.. |
|
|
|
Post by EmRR on Aug 21, 2018 17:01:10 GMT -6
Just print this out and tape it above your pultec. BOOM. Of course this is just about completely unhelpful. Does it assume equal amounts of cut and boost? Is that how you use it? Again, you can decode some of that answer looking at my plots and reading the text. Answer is sorta yes, I'm not gonna bother going back to read my old data to be more specific. |
|
|
|
Post by adamjbrass on Aug 21, 2018 17:18:24 GMT -6
This is an interesting idea. It’s funny, because I have a friend, Dan Foley from Audio Precsion, who sells AP’s and is an EPIC measurement guy, (he is really into measurement with these machines (their GUI software plots out EVERY data point known in science, and graphically represents them with time domain and amplitude plots (and any plots you want..) and just the other day, for laughs we decided to measure the EQP-KT box that’s in here. We plotted all its LFS/Peak/HFS curves, and it was super interesting how good it measured for the price!!. But, We did not plot it with both boost cut knobs in action, only one knob at a time...so now reading through this thread, it seems easy enough to measure the knobs at each step of the way with a $20,000 AP — and then somehow extrapolate the Graphical representation of the frequency plots to show the knee shape and curves interacting with each other. You probably need some code/programming knowledge to make that work in tandem with the plug ins control knobs. Doable and should be done.
|
|